The world's oil chokepoint,
watched in real time by AI.
HormuzWatch tracks every vessel, news headline, and market signal at the Strait of Hormuz and runs them through a live Apache Flink + Claude AI pipeline that generates intelligence briefings, trajectory forecasts, risk heatmaps, and throughput estimates updated in seconds.
A morning
at the strait.
A dark AIS event and a news alert arrive within minutes of each other. This is how the pipeline responds — from raw signal to intelligence briefing in under five minutes.
Illustrative scenario based on real system behaviour.
33 kilometres.
One fifth of world supply.
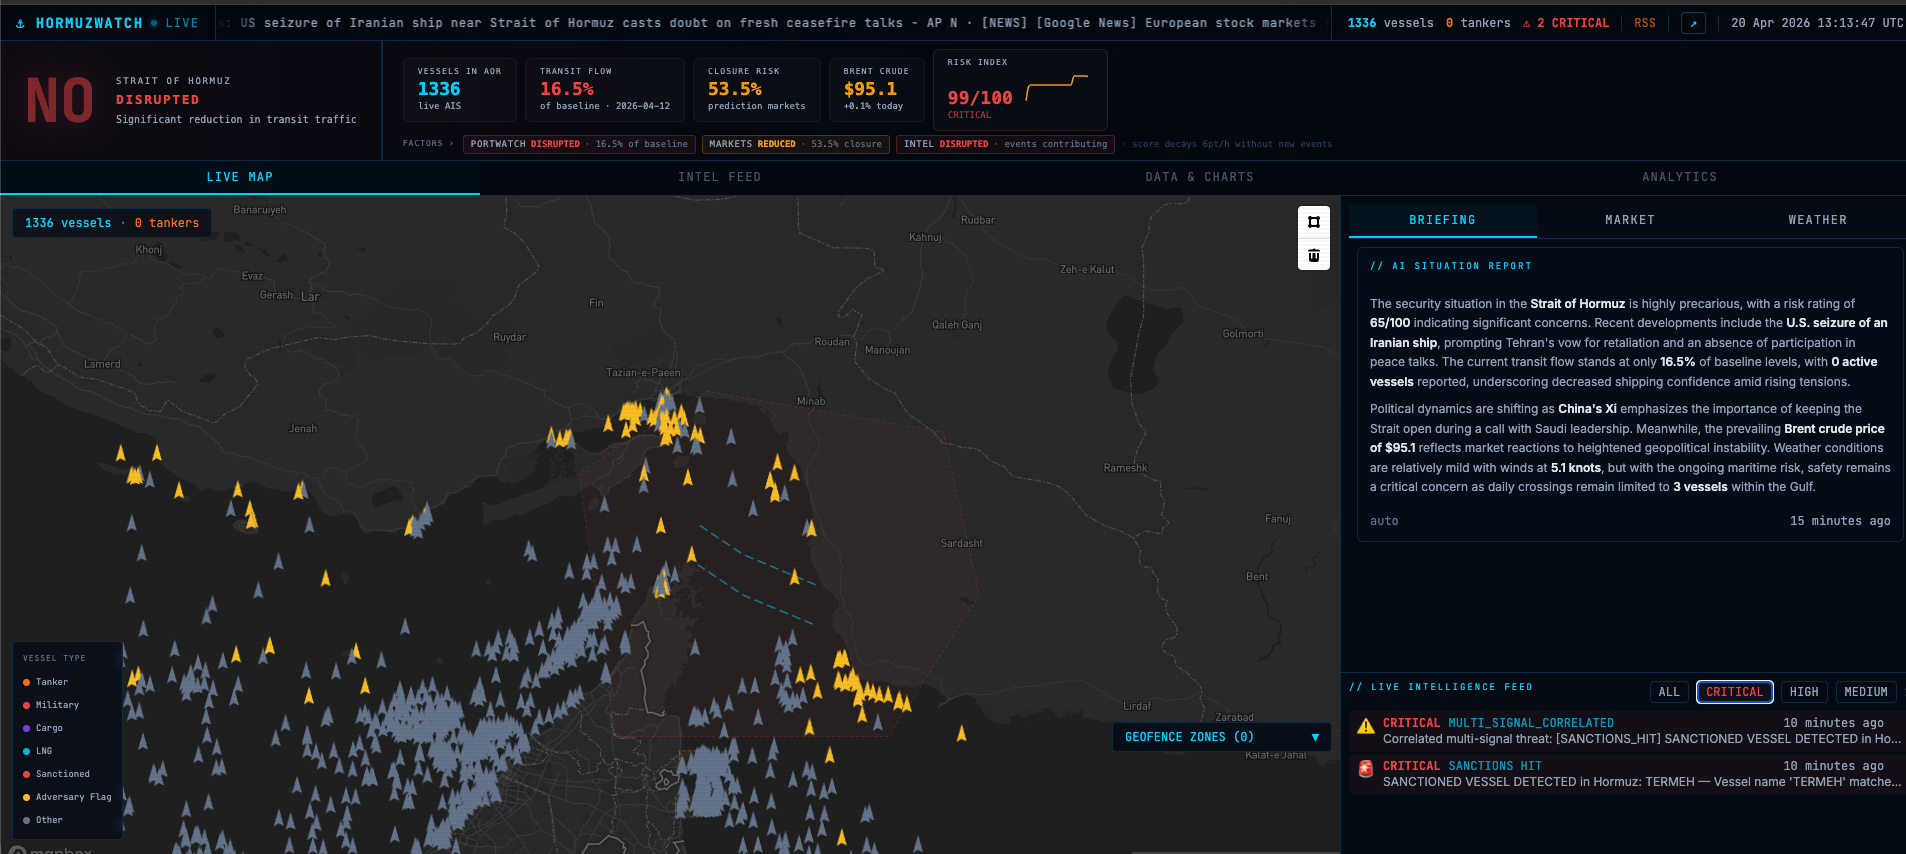
The Strait of Hormuz sits between Iran and Oman at the mouth of the Persian Gulf. At its narrowest point it is 33 kilometres wide. Roughly 20% of the world's daily oil supply passes through it — about 17–21 million barrels every day.
Any disruption — an Iranian vessel seizure, a naval confrontation, a credible closure threat — sends commodity markets moving within hours. What is physically happening in the strait is directly relevant to energy traders, shipping analysts, and anyone tracking how a narrow waterway shapes the global economy.
Iran closure threat
In response to threatened EU oil embargo, Iran warns it will close the strait. US 5th Fleet deploys additional assets. Tanker war-risk insurance rates spike 200% in 48 hours.
Military vessel clustering near strait mouth; commercial traffic bunching at Fujairah anchorage.
US-EU sanctions peak
EU embargo on Iranian oil takes effect. Shadow fleet begins to emerge as Iran routes oil through intermediaries. Dark AIS events increase 340% vs. baseline in the strait area.
Persistent dark AIS clusters near Qeshm and Larak Islands. Ship-to-ship transfers in open Gulf waters.
Tanker attacks
MT Front Altair and Kokuka Courageous attacked by limpet mines. USS Abraham Lincoln carrier strike group deployed. Brent crude rose 4% in 24 hours. Lloyd's of London suspends war-risk cover.
Anomalous military proximity to tanker lanes in days prior. Unusual clustering of small vessels near incident coordinates.
Houthi escalation
Houthi attacks on Red Sea shipping trigger partial re-routing via Cape of Good Hope. Hormuz traffic holds steady but freight rates for alternative routes surge 300%. Shadow fleet activity increases.
Shift in tanker routing choices visible in AIS. Sanctioned vessel density in Hormuz increases as compliant fleet avoids Red Sea.
What the system
actually does.
A streaming data pipeline and a monitoring dashboard. The pipeline ingests AIS transponder data, news feeds, commodity prices, and prediction markets, processes them through twelve Flink stream processors on Ververica Cloud, and synthesises the results with Claude. The dashboard makes all of it visible and queryable.
Live vessel tracking
Every commercial ship in the strait tracked in real time from three AIS sources. Ships render as directional icons colour-coded by type: orange tankers, red military, cyan LNG. 12-position trail lines and a mouseover detail panel show MMSI, speed, flag, and nav status.
Sanctioned vessel detection
Known IMO-sanctioned MMSIs matched against the live AIS feed. Iranian Revolutionary Guard vessels and shadow fleet tankers glow red on the map and trigger immediate CRITICAL intelligence events with no analyst intervention.
AI situation reports
Claude consumes the intelligence event stream and generates plain-language briefings citing historical precedents: 2019 tanker attacks, 2012 sanctions, 2011 closure threat. A four-layer cost control system keeps the daily AI cost at cents.
Market correlation
WTI and Brent crude, LNG futures, tanker stocks, energy majors, and Polymarket/Kalshi prediction market odds updated every 30 seconds. Maritime intelligence and commodity signals on the same screen.
Trajectory forecasting
Dashed prediction lines extend from every moving vessel at 15, 30, 45, 60, 90, and 120 minutes. Flink haversine dead-reckoning runs per vessel at ≥ 1.0 kt. Analysts can see if a military vessel intersects tanker lanes before it arrives.
Natural language queries
A chat panel accepts plain-English questions grounded in live Flink-processed state. Answers stream token-by-token via SSE. Ask about specific vessels, compare today's risk to past incidents, or query current throughput.
Risk heatmap
A Mapbox fill layer shades 0.2° geographic grid cells from transparent green through amber to glowing red. During chokepoint events, risk concentrates at the strait mouth near Qeshm Island — visible immediately without reading the intel feed.
Analyst geofence studio
Draw any polygon on the map; it becomes a live monitoring zone. The Flink DynamicGeofenceFilter uses JTS polygon containment for O(1) testing on every AIS position. Zones persist across sessions with no code changes required.
What Claude
actually generates.
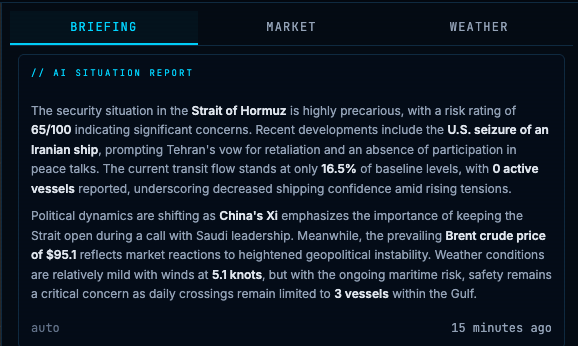
Real output from the live system. Risk 65/100 · U.S. seizure of Iranian ship TERMEH · Brent $95.1
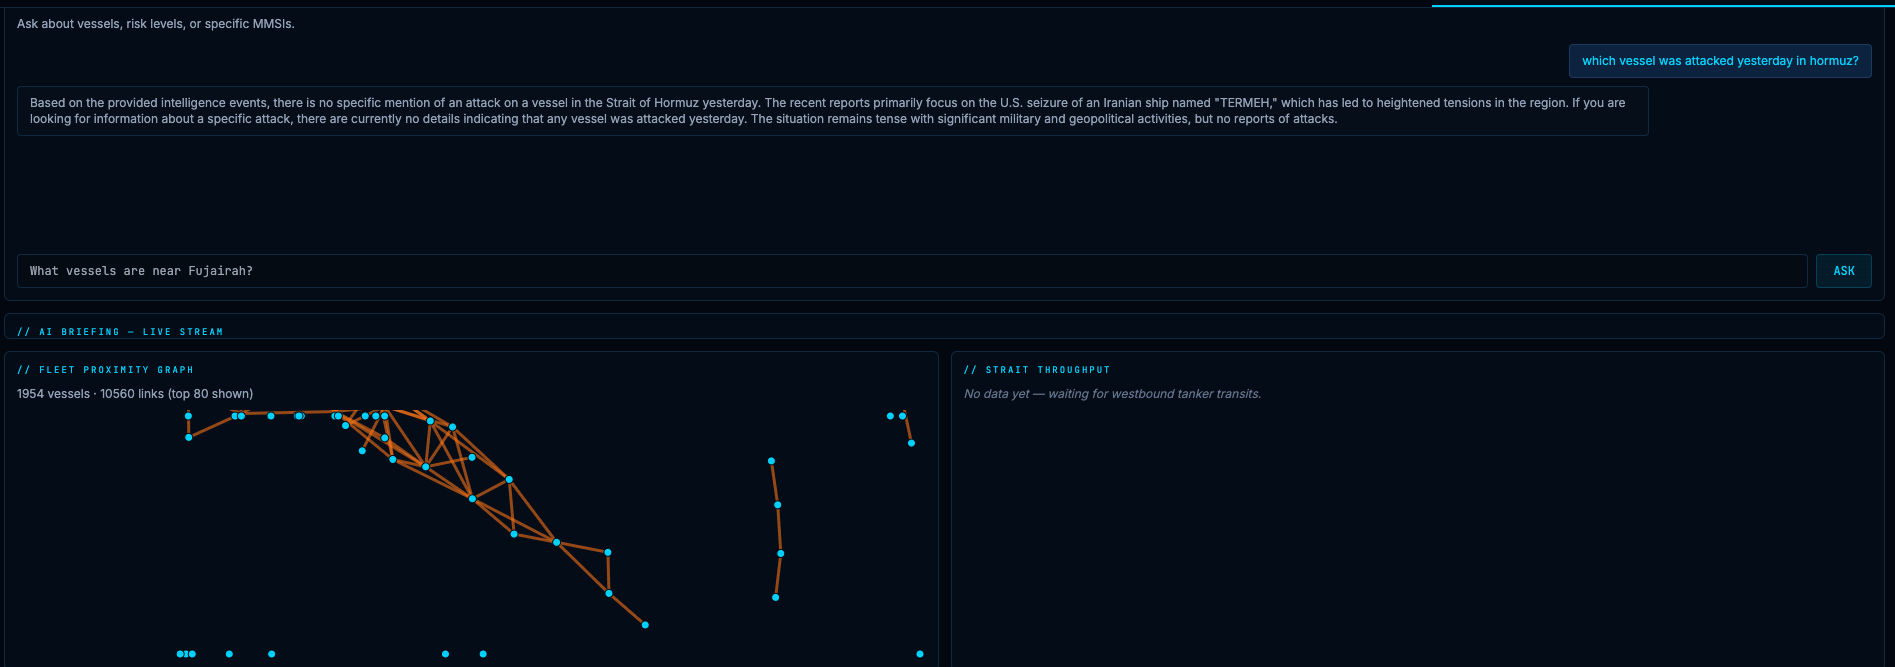
which vessel was attacked yesterday in hormuz?
Based on the provided intelligence events, there is no specific mention of an attack on a vessel in the Strait of Hormuz yesterday. The recent reports primarily focus on the U.S. seizure of an Iranian ship named "TERMEH," which has led to heightened tensions in the region. The situation remains tense with significant military and geopolitical activities, but no reports of attacks.
How data flows
through the system.
Four patterns,
twelve detectors.
The technology
I work with every day.
I work at Ververica, the company that created Apache Flink. My job is helping organisations build real-time data systems. HormuzWatch is what happens when you point that same technology at something you want to understand about the world.
I love using stream processing to explain complex situations to people. Real-time data removes the delay that news coverage introduces and makes the underlying patterns legible to anyone paying attention. Ververica Cloud handles deployment, scaling, job restarts, and monitoring. I handle the detection logic. That division of responsibility is what makes a system this complex buildable by one person.
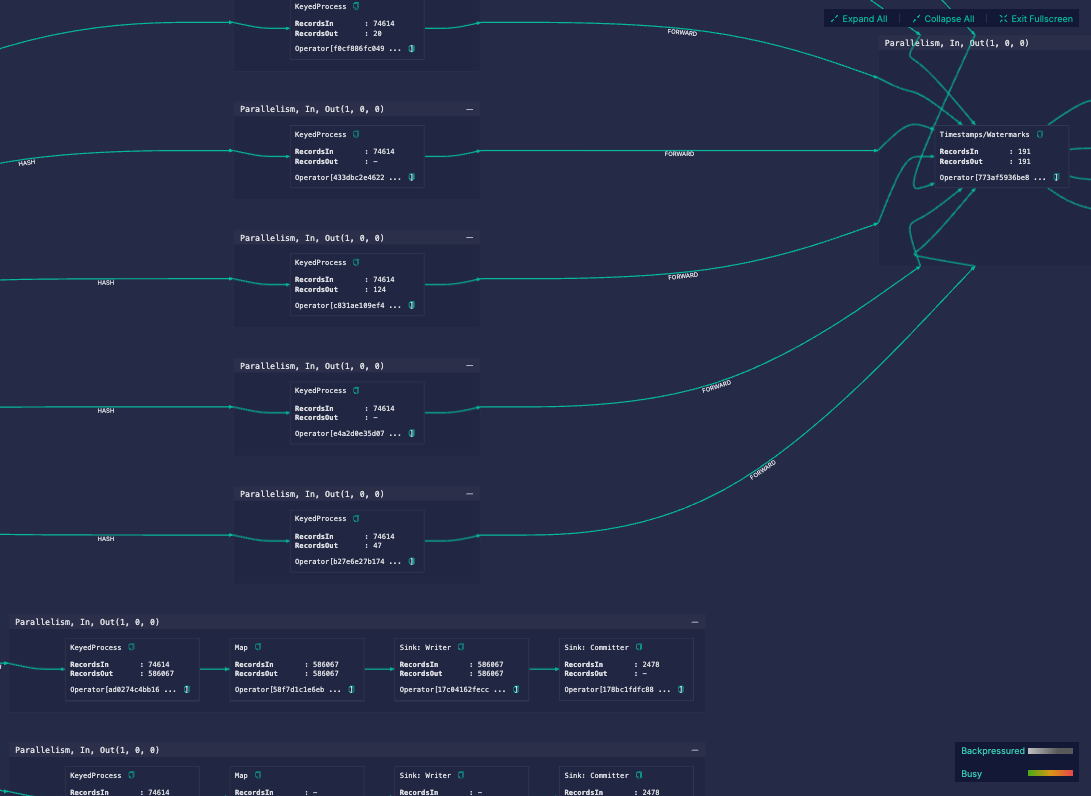
HormuzWatch Flink job DAG running live on Ververica Cloud — 74,614 records in per operator
Four layers.
Cents per day.
Running Claude continuously on a live event stream could easily cost hundreds of dollars per day. A four-layer control system keeps daily spend at $0.02–$0.15 while ensuring briefings update within two minutes of any meaningful event.
Significance scoring
Every intelligence event is scored 0–100. Routine traffic fluctuations and repeated minor anomalies never reach the AI layer.
Delta-based triggering
Even above the significance threshold, synthesis only runs if the event meaningfully changes system state. Duplicate signals within a short window are deduplicated.
Model tiering
Risk < 40: no synthesis. Risk 40–69: Claude Haiku. Risk ≥ 70: Claude Sonnet. Claude Opus reserved for analyst NL queries only.
2-minute rate limit
Synthesis runs at most once every 2 minutes even if all conditions are met. Prevents burst costs during fast-moving events while keeping briefings current.
Technology that
explains the world.
The Strait of Hormuz carries roughly one-fifth of the world's daily oil supply through a passage 33 kilometres wide at its narrowest point. In April 2025, with US-Iran tensions at a decade high, I kept watching news headlines but could not find anything that showed me what was actually happening in the strait, in real time.
I had built AISGuardian for Baltic Sea infrastructure protection and knew the data existed. AIS transponders broadcast from every commercial vessel. News feeds were parseable. Commodity prices were accessible. What did not exist was a system that connected all three streams, found the patterns, and explained what they meant.
HormuzWatch started as a Kafka + Flink + React stack that flagged AIS anomalies. Then I added Claude to turn the anomaly stream into intelligible briefings. Then market data, prediction markets, precedent-aware context, and a second sprint that added ten new capabilities including real-time NL queries, trajectory forecasting, and an analyst geofence studio.
The result is a system I actually use. When something happens at Hormuz, I open the dashboard.
AISGuardian
Maritime vessel tracking for Baltic Sea critical infrastructure. The predecessor to HormuzWatch, built during the Aiven Kafka Challenge. Same stack, different mission: cable protection instead of commodity market intelligence.
Let's build something
worth talking about.
I take on a limited number of advisory and fractional engagements. Only projects where I can make a real difference. If you're navigating growth, AI, or revenue challenges in a technical B2B environment, let's talk.